


How Can Affiliates Automate Reporting with Dashboards?
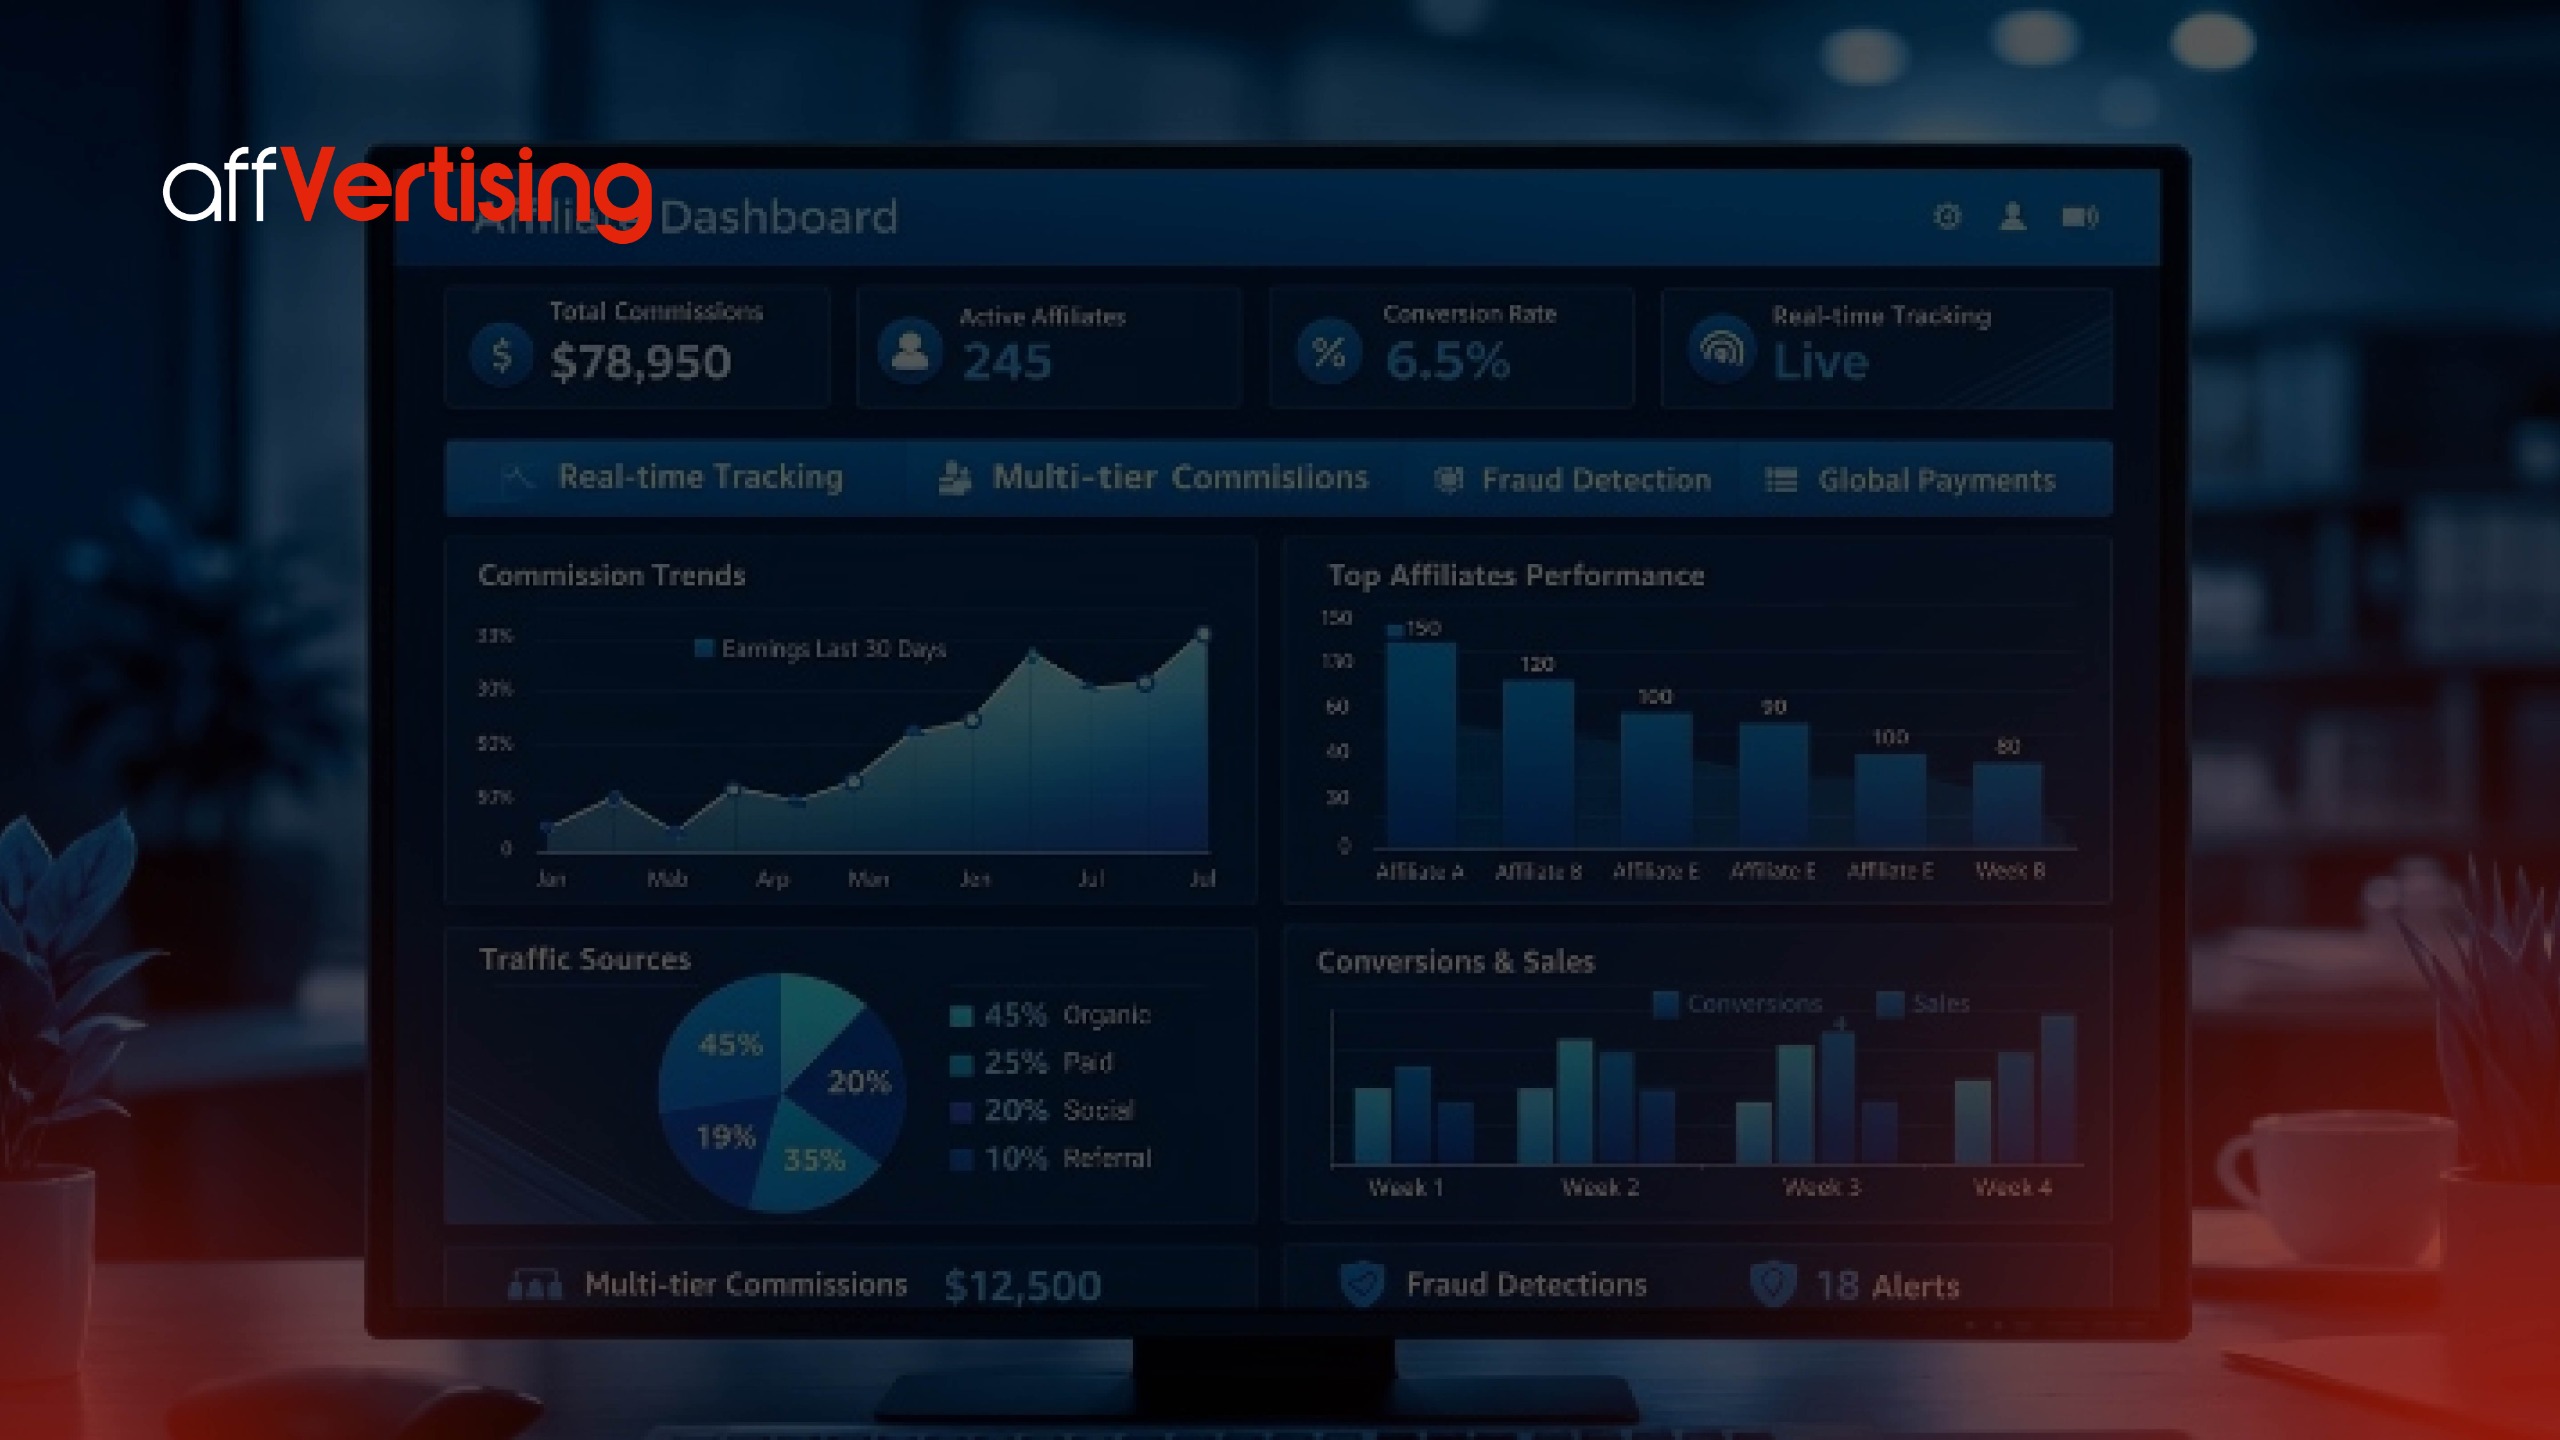
Automating affiliate reporting with dashboards allows marketers to streamline complex data workflows by consolidating multiple data sources into a single, centralized visualization platform. Instead of manually exporting spreadsheets from different networks, tracking conversions, or cross-checking revenue, affiliates can now see performance trends in real-time, detect anomalies instantly, and make informed decisions quickly. This not only saves time but also reduces errors, enhances strategic planning, and allows marketers to optimize campaigns effectively across multiple networks, products, and promotional channels simultaneously.
Dashboards act as a command center for affiliate marketers, where key performance indicators (KPIs), earnings, traffic metrics, and conversion statistics are aggregated and presented visually through charts, graphs, and interactive tables. This creates a single source of truth, which is crucial when managing large-scale campaigns, multiple offers, and diverse affiliate programs.
What Is Affiliate Reporting Automation?
Affiliate reporting automation is the process of leveraging software tools and dashboards to automatically collect, normalize, and visualize affiliate performance data. Instead of relying on manual downloads, copying, and merging reports, automation systems continuously pull real-time data from all affiliate networks and platforms, ensuring that the marketing team always has an up-to-date, accurate overview of campaigns.
Automated reporting eliminates repetitive administrative tasks and frees affiliates to focus on strategy, content optimization, and revenue growth. With automation, marketers can spot trends, detect underperforming campaigns, and identify high-converting offers faster than ever before.
Key Entities in Affiliate Reporting Automation
| Entity | Definition | Role |
| Affiliate | Digital marketer promoting products | Generates traffic and conversions |
| Merchant | Product or service owner | Provides program data and payout details |
| Affiliate Network | Platform linking affiliates and merchants | Tracks clicks, sales, and commissions |
| Dashboard | Visualization tool | Consolidates KPIs and presents metrics interactively |
| Tracking Software | Backend system | Captures click, lead, and sale data |
| API | Application Programming Interface | Enables seamless data integration from multiple platforms |
Each of these entities plays a critical role in the automation ecosystem, ensuring that data flows smoothly from affiliate campaigns to actionable insights without manual intervention.
Core Benefits
- Eliminates Manual Reporting Tasks – Affiliates no longer spend hours exporting CSVs from each network and compiling them manually in spreadsheets. Automated dashboards pull all necessary data at pre-defined intervals.
- Provides Real-Time Insights – Immediate access to live data allows marketers to adjust campaigns dynamically, optimize high-performing offers, and reduce wasted spend.
- Improves Decision-Making Accuracy – By visualizing data in intuitive formats, marketers can detect patterns and anomalies that may not be apparent in raw tables.
- Enables Multi-Network Performance Comparison – Consolidation of Amazon Associates, ClickBank, CJ Affiliate, Impact, and other networks into a single dashboard enables cross-platform performance analysis, making it easier to determine which offers or campaigns are driving the best ROI.
Example:
An affiliate managing campaigns across Amazon Associates, ClickBank, and CJ Affiliate can aggregate all metrics into one dashboard to view total clicks, conversions, EPC, and revenue, enabling faster strategic decisions without juggling multiple spreadsheets.
Why Is Automating Affiliate Reporting Important?
Affiliate reporting automation is essential because managing multiple networks and campaigns manually is time-consuming, error-prone, and inefficient. As affiliates scale operations, the complexity grows exponentially, making manual reporting unsustainable. Automation ensures accuracy, speed, and scalability, which are crucial for modern affiliate marketing success.
Key Advantages
- Time Savings: Reduces manual report generation by up to 80%, freeing affiliates to focus on strategy.
- Accuracy: Eliminates miscalculations, incorrect totals, or missed conversions from human error.
- Real-Time Insights: Facilitates instant recognition of trends, anomalies, and performance dips.
- Scalability: Supports hundreds of campaigns across multiple networks without additional labor.
- Decision Optimization: Enables immediate strategy adjustments, A/B testing, and revenue optimization based on live data.
Hypothetical Example:
Manual reporting:
- 5 networks × 3 campaigns each
- Exporting, compiling, and cleaning data = 5 hours/week
Automated dashboard:
- All networks combined, report generated automatically
- Time required = 5 minutes
Time saved:
~4 hours 55 minutes weekly per affiliate manager, which can be redirected to campaign growth, content creation, or audience engagement.
What Metrics Should Be Tracked on Affiliate Dashboards?
Dashboards consolidate all critical KPIs into a single visual interface, enabling affiliates to quickly assess performance and optimize campaigns. Proper KPI selection ensures affiliates focus on the most impactful metrics that directly influence revenue and conversions.
Essential Metrics
| KPI | Formula | Insight |
| Click-Through Rate (CTR) | Clicks / Impressions × 100 | Measures engagement efficiency and interest level |
| Conversion Rate | Conversions / Clicks × 100 | Assesses traffic quality and offer appeal |
| Earnings Per Click (EPC) | Revenue / Clicks | Evaluates profitability per click and campaign efficiency |
| Average Order Value (AOV) | Revenue / Transactions | Tracks purchase behavior and higher-value conversions |
| Commission | Units Sold × Commission Rate | Monitors total revenue generated by campaign |
| Refund Rate | Refunds / Transactions × 100 | Highlights product quality or compliance issues |
Example Calculation:
- Traffic = 10,000 clicks
- Conversions = 200
- Commission per unit = $50
- Conversion Rate = 200 ÷ 10,000 × 100 = 2%
- Revenue = 200 × $50 = $10,000
- EPC = $10,000 ÷ 10,000 clicks = $1 per click
Dashboards allow these metrics to be visualized with line charts, bar graphs, and heatmaps, making trends, high-performing offers, and underperforming campaigns immediately apparent.
How Do Dashboards Integrate Multiple Affiliate Networks?
Integration is a critical component of reporting automation. Dashboards need to pull data from all active networks, normalize it, and present it in a coherent format. Without integration, affiliates risk fragmented reporting, duplicated effort, and inconsistent metrics.
Methods of Integration
- Native API Connections: Direct data sync with networks like Amazon Associates, Impact, or ShareASale.
- Third-Party Aggregators: Platforms like Voluum, Tapfiliate, or Wicked Reports consolidate data from multiple networks.
- CSV Upload Automation: Scheduled imports of CSV exports from networks that don’t provide APIs.
- Custom ETL Pipelines: Advanced Extract-Transform-Load scripts pull data into centralized databases for highly customized dashboards.
Example Dashboard Architecture
| Layer | Function |
| Data Source | Affiliate networks, tracking platforms, and ad networks |
| ETL Layer | Cleans, transforms, and normalizes raw data |
| Data Warehouse | Centralized storage for historical and real-time data |
| Dashboard | Visualization and reporting interface for metrics monitoring |
This architecture supports scalable, automated reporting, allowing affiliates to track multi-network campaigns, analyze historical trends, and optimize in real-time without manual intervention.
What Are the Steps to Build an Automated Affiliate Dashboard?
Building a functional and high-impact affiliate dashboard requires a structured approach that combines thoughtful planning, robust data integration, intuitive design, and ongoing optimization. A well-designed dashboard goes beyond merely displaying numbers; it transforms raw affiliate data into actionable insights that empower marketers to make rapid, informed decisions that directly impact revenue and growth.
Step-by-Step Implementation
- Define Objectives
Begin by establishing clear goals for the dashboard. Decide which KPIs are most relevant to your affiliate strategy, whether it’s tracking clicks, conversions, EPC, or multi-network revenue. Align objectives with business priorities to avoid cluttering the dashboard with unnecessary metrics. - Select Tools
Choose software that fits your reporting needs. Options vary from free, user-friendly platforms like Google Data Studio to enterprise-grade analytics tools like Power BI and Tableau, or affiliate-specific trackers like Voluum and Tapfiliate. Consider integration flexibility, scalability, and visualization capabilities. - Connect Data Sources
Aggregate data from all affiliate networks and marketing platforms. This can be done using native APIs, CSV imports, or custom ETL scripts. Proper data connection ensures real-time updates and reliable metrics across networks. - Normalize Data
Standardize KPIs so that comparisons across networks are meaningful. For example, one network may report conversion as “leads,” another as “sales.” Normalization ensures consistency in units, timeframes, and metrics definitions. - Design Visualization
Use charts, tables, and scorecards to clearly communicate key insights. Visualizations should highlight trends, anomalies, and actionable metrics. For instance, a heatmap showing high-converting campaigns allows marketers to focus on high-value traffic sources. - Set Automation Schedules
Define how frequently dashboards refresh data—daily, weekly, or hourly. Automated updates prevent outdated reporting and support timely strategic decisions, especially during peak promotional campaigns. - Implement Alerts
Configure notifications for KPI thresholds or unusual activity. Examples include sudden drops in CTR, abnormal EPC fluctuations, or conversion rate declines. Alerts ensure that affiliates can act immediately to prevent revenue loss. - Test Accuracy
Validate all metrics against raw network reports. Cross-checking ensures that API data, ETL pipelines, and calculations are functioning correctly, maintaining the integrity of the dashboard.
What Tools Are Most Effective for Affiliate Dashboard Automation?
Choosing the right tools is critical to ensure accuracy, flexibility, and scalability. The most effective solutions combine robust data integration, intuitive visualization, and advanced automation.
Popular Dashboard Tools
| Tool | Description | Integration Capabilities |
| Google Data Studio | Free, flexible visualization platform | Connects via APIs, CSV, Google Sheets |
| Power BI | Enterprise-grade analytics tool | Supports multiple data connectors for extensive networks |
| Tableau | Advanced visualization and interactive dashboards | Real-time API & database integration |
| Voluum | Affiliate-specific tracking and dashboard | Built-in network integrations and conversion tracking |
| Tapfiliate | Affiliate program management platform | Dashboard automation and reporting tools |
Supporting Technologies:
- ETL platforms like Fivetran for automated data extraction and transformation.
- Cloud-based data warehouses like BigQuery for centralized storage and scalable querying.
- Alerting systems such as Slack or email notifications to deliver actionable insights in real-time.
How Can Real-Time Dashboards Improve Affiliate Decision-Making?
Real-time dashboards provide immediate visibility into campaign performance, allowing affiliates to detect anomalies, optimize conversions, and allocate resources efficiently. The faster marketers identify trends, the faster they can adjust campaigns to prevent revenue loss or capitalize on high-performing strategies.
Practical Use Cases
- Detect sudden drops in conversion rates → investigate landing page issues.
- Identify top-performing networks → allocate budget efficiently.
- Monitor EPC fluctuations → test alternative offers or creative variations.
Hypothetical Scenario:
- Campaign A’s CTR drops from 4% → 1% overnight.
- Real-time alert triggers investigation of the traffic source and ad creative.
- Action prevents a potential revenue loss of $5,000/month.
Without a real-time dashboard, this drop could go unnoticed for days, leading to compounded losses.
What Are Common Pitfalls in Affiliate Reporting Automation?
Even sophisticated dashboards can fail if data quality, design, or alert systems are not properly implemented. Awareness of pitfalls allows affiliates to avoid costly mistakes.
Frequent Mistakes:
- Ignoring data normalization → inaccurate multi-network comparisons.
- Overloading dashboards with unnecessary KPIs → decision paralysis.
- Not validating API or ETL data → mismatched results with network reports.
- Missing alerts → delayed response to performance drops.
- Infrequent updates → stale insights preventing timely optimization.
Mitigating these risks ensures accurate, reliable, and actionable insights, which are essential for strategic campaign management.
How Can Performance Benchmarks Be Incorporated?
Benchmarks act as reference points to evaluate campaign success and detect underperforming initiatives. Dashboards can highlight metrics relative to industry or historical benchmarks, enabling rapid decision-making.
Typical Benchmarks:
| Metric | Industry Average |
| CTR | 2–5% |
| Conversion Rate | 1–3% |
| EPC | $0.50–$5 depending on niche |
| Refund Rate | <5% |
By tracking performance against these benchmarks, affiliates can quickly identify campaigns that require optimization or opportunities for scaling.
How Can Dashboards Support Multi-Channel Affiliate Strategies?
Affiliate marketers increasingly operate across diverse channels, including organic SEO, paid search, email, social media, and content networks. Dashboards centralize all channels, allowing holistic performance assessment.
Example Multi-Channel Dashboard:
| Channel | Clicks | Conversions | Revenue | EPC |
| SEO | 5,000 | 100 | $3,000 | $0.60 |
| PPC | 2,000 | 70 | $2,800 | $1.40 |
| 1,500 | 50 | $2,500 | $1.67 |
This consolidated view allows marketers to reallocate budgets and focus on high-performing channels, rather than relying on fragmented reports.
What Advanced Features Can Enhance Affiliate Dashboards?
Advanced features elevate dashboards from static reporting tools to dynamic, predictive intelligence systems.
Key Features:
- Predictive Analytics: Forecast revenue and conversions based on historical trends.
- Anomaly Detection: AI-driven alerts identify unusual traffic or conversion patterns.
- Custom Alerts: Notifications for KPI thresholds tailored to affiliate goals.
- Dynamic Filters: Segment data by date, campaign, network, or geographic region.
- Automated Reports: Scheduled PDF or email reports provide stakeholders with consistent insights.
These features save time, reduce human error, and empower affiliates to act proactively rather than reactively.
How Do Dashboards Facilitate Scaling of Affiliate Programs?
Dashboards are critical for scaling because they centralize data, streamline decision-making, and enhance operational efficiency. When affiliates expand campaigns across networks, offers, or content channels, dashboards ensure consistent monitoring and optimization.
Scaling Framework:
- Consolidate metrics across networks.
- Identify top-performing campaigns.
- Allocate traffic and budget to high performers.
- Automate reporting for new campaigns.
- Monitor KPIs in real-time to prevent wasted spend.
Hypothetical Case Study:
- 10 campaigns monitored → top 3 performers identified.
- Budget reallocation increases revenue by 35% within one month.
- Reporting time reduced from 10 hours/week → 1 hour/week.
Automation transforms the dashboard into a scalable decision engine, enabling affiliates to grow revenue without proportional increases in effort.
What Future Trends Will Impact Affiliate Reporting Dashboards?
Dashboards are evolving rapidly due to AI, privacy regulations, and cloud technologies. Forward-looking affiliates must adapt to stay competitive.
Emerging Trends:
- AI-driven KPI predictions and anomaly detection.
- Cookieless tracking to comply with privacy regulations.
- Multi-device attribution modeling to understand complex user journeys.
- Voice-command dashboard interactions for instant access to insights.
- Real-time cloud-based reporting for distributed teams and global campaigns.
Marketers who adopt next-gen dashboards will gain a competitive advantage by responding faster and optimizing more effectively than those relying on manual or fragmented reporting systems.
Master Framework: Automating Affiliate Reporting
The 9-Step Dashboard Automation Framework ensures accuracy, efficiency, and actionable insights across campaigns and networks:
- Define objectives and KPIs.
- Select appropriate dashboard tools.
- Integrate all affiliate networks via API or ETL.
- Normalize data for cross-network comparability.
- Design visualizations for clarity and actionable insights.
- Implement scheduled automation and real-time updates.
- Set alerts for KPI anomalies.
- Conduct periodic audits to validate data accuracy.
- Incorporate predictive and multi-channel analytics for accuracy.
Affiliate Dashboard Automation Implementation Checklist
✔ Determine primary KPIs for reporting
✔ Choose dashboard software and integration method
✔ Connect all affiliate networks via API/ETL
✔ Normalize and clean incoming data
✔ Build visualizations (charts, tables, scorecards)
✔ Schedule automated updates and reports
✔ Set alert thresholds for critical metrics
✔ Validate data against network reports
✔ Segment by channel, campaign, and timeframe
✔ Integrate predictive analytics for proactive decision-making
Expert Insight
Automating affiliate reporting transforms raw performance data into actionable business intelligence. Dashboards reduce human error, streamline decision-making, and empower affiliates to scale campaigns efficiently across networks and channels. High-performing affiliates treat dashboards as strategic tools, not just reporting utilities—they drive optimization, identify new revenue opportunities, and proactively prevent performance dips.
In a highly competitive affiliate landscape, automated dashboards provide the time-saving, accuracy, and strategic insights necessary to outperform manual reporting methods, giving affiliates a substantial competitive edge.